Biodiversity monitoring
Revealing species diversity to guide effective conservation.
We provide seamless, end-to-end biodiversity monitoring and diet analysis and deliver high-quality results with robust data analysis. Our services are designed to provide a streamlined experience, allowing you to focus on your conservation goals while we manage the technical aspects of eDNA analysis.
32
Trusted by project partners
Our 2025 metabarcoding analysis in numbers:
13
From countries
10,000+
Multi-species tests
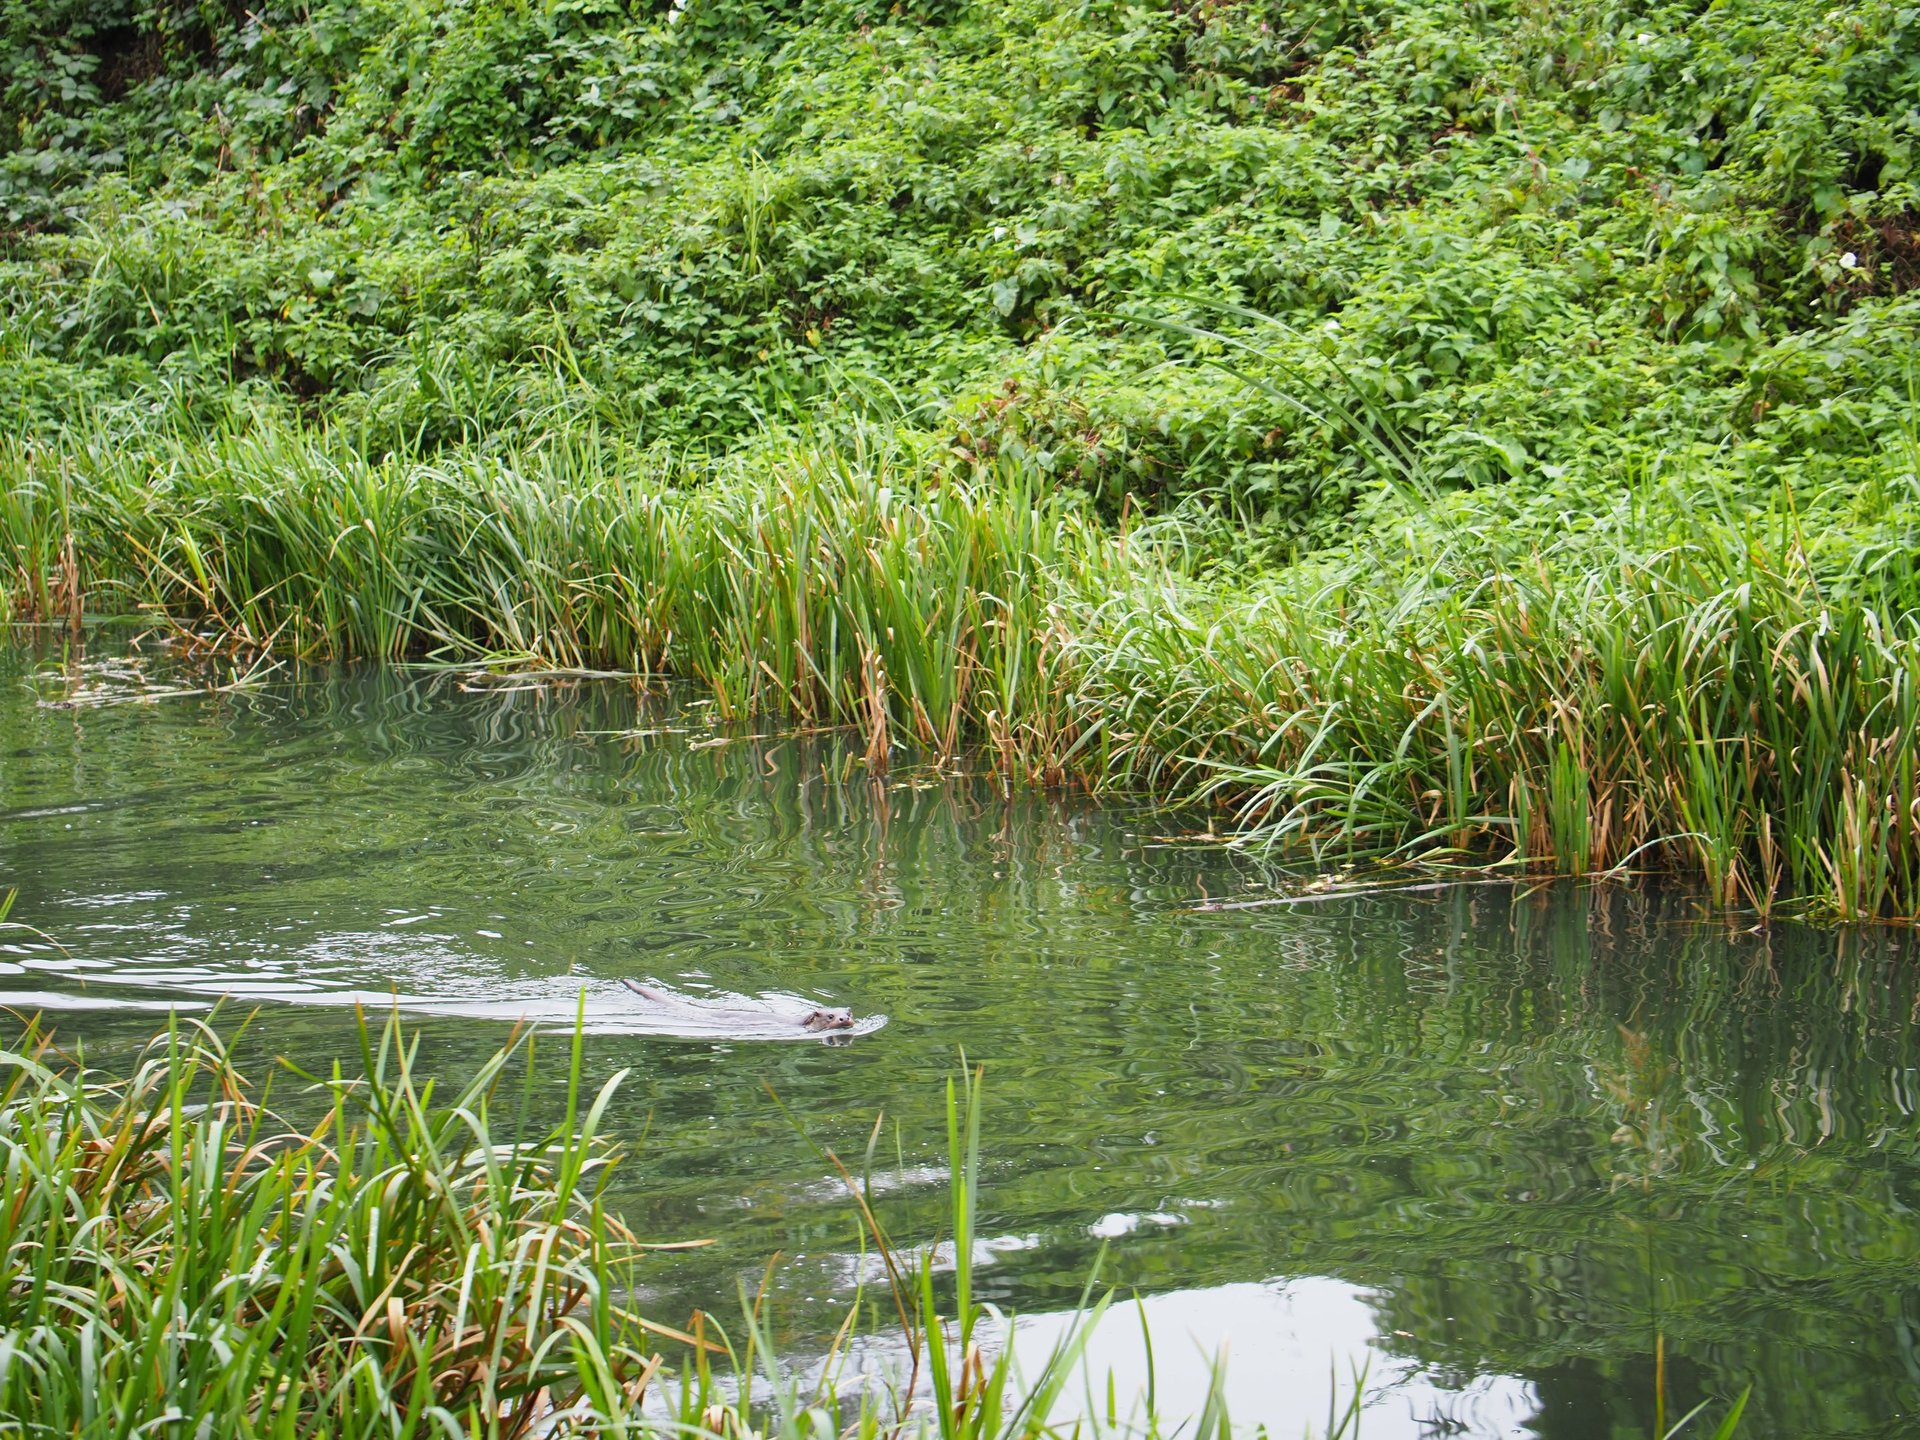
Like any survey, monitoring biodiversity with eDNA requires different approaches for different taxa. We will help you choose the best approach for your project or suggest a combination if appropriate.
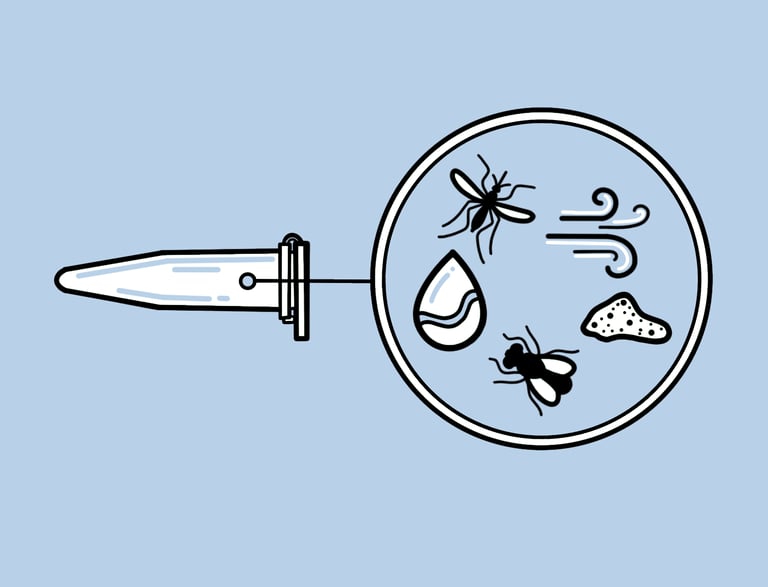
Whether you’re tracking aquatic species, surveying terrestrial wildlife, assessing soil communities, or testing emerging airDNA approaches, we’ve got you covered.
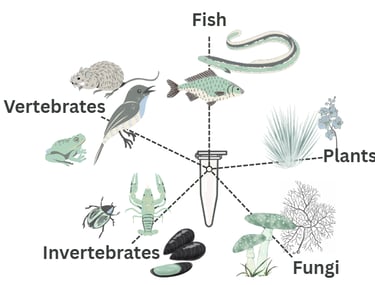
Some example target groups we regularly monitor with eDNA include:
As experienced researchers we’re happy to develop new methods if you have a novel project that needs a bespoke approach. We are experts in survey design and happy to help you refine your methodology.
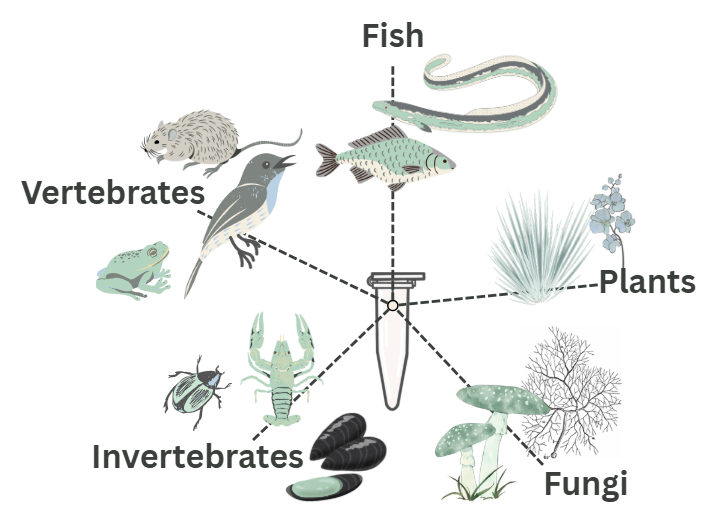
One target group
Choose from fish, vertebrates, mammals, invertebrates, fungi and plants.
£260+VAT
Soil and terrestrial kits
Each additional target group
Up to three groups per sample.
Electric pump hire
£100+VAT /day
£20+VAT
£120+VAT
Pricing
Our pricing follows a tiered model. As project size increases, the cost per sample decreases. Tiered pricing begins at 50 or more samples and reduces again for projects over 200 samples.
Projects with < 50 samples:
Hire our electric pump to speed up fieldwork and cut costs. Pump compatible sample kits are £17 +VAT
Our single use sampling kits are designed to be lightweight and easy to use. Samples will be preserved at room temperature for up to six months.
Our single use sampling kits are designed to increase water filtration and are capable of filtering >3 L per sample, maximising detection success.
Sterile aquatic sample kit
£22.50 +VAT
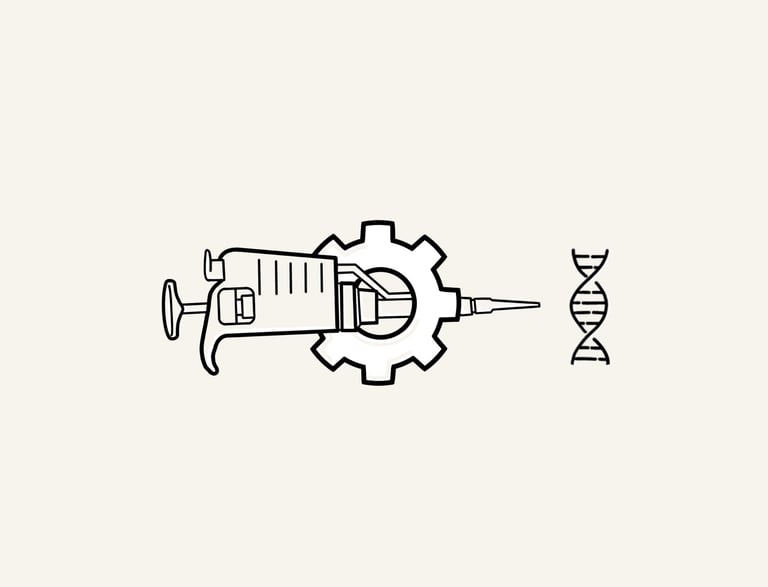
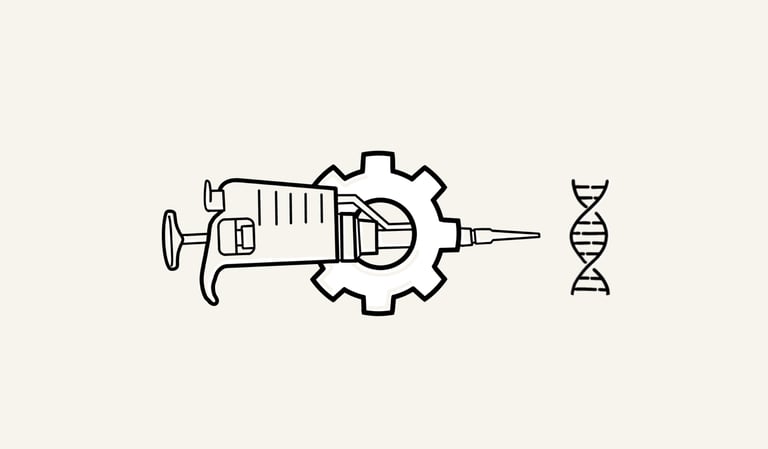
We believe in delivering a premium service you can trust. By interrogating your samples with 12 PCR replicates we give you the best chance of detecting rare, elusive, or invasive species.
In certain cases, we can adjust replicate numbers to help you stay within your budget, but we never analyse less than 8 replicates. Read more about why this matters here.
eDNA samples for biodiversity or diet monitoring can be collected with our aquatic, terrestrial, soil and faecal kits.
We include free field controls and laboratory controls in all of our surveys to ensure your data is robust and publication ready.
Our metabarcoding analysis turnaround time is 6-8 weeks from receipt of samples.
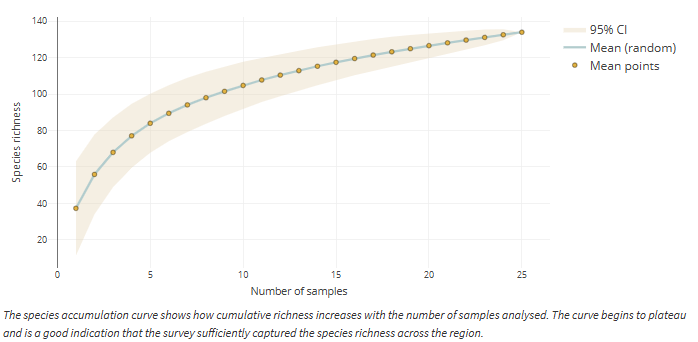
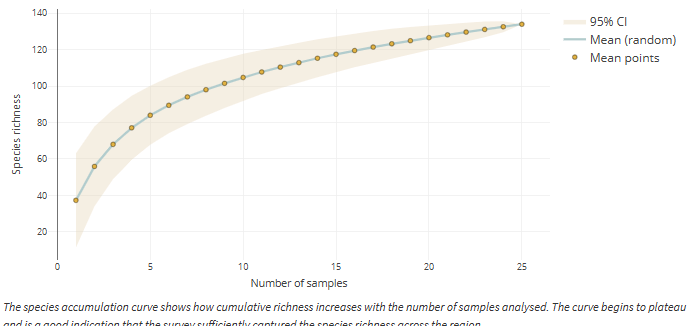
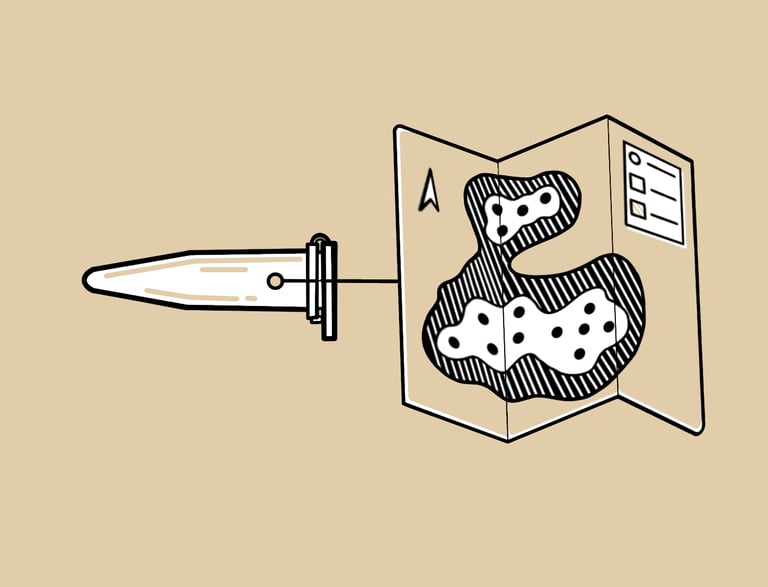
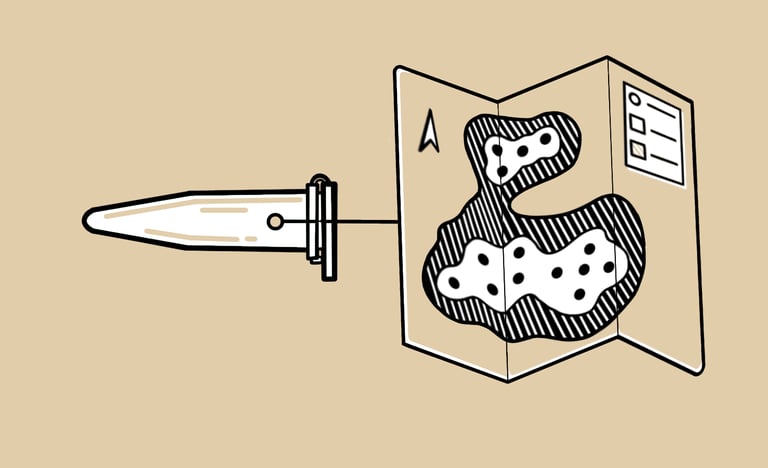
As standard we will map your results and carry out correlation analysis with any of the metadata you provide us (e.g. water chemistry, volume filtered, habitat characteristics etc.). Additionally species accumulation curves will uncover whether increased sampling intensity would have increased species richness, helping you to refine your survey protocols.

What we deliver
Additional modelling can be included in your results delivery upon request. This could include occupancy modelling or functional diversity analysis.


The eDNA Consultancy
Where our expertise meets yours
ADDRESS
Unit 1, Tanhouse Farm, Frampton on Severn, Gloucestershire, GL2 7EH, GB
INQUIRE ABOUT OUR SERVICES
Web design and graphics by Bear Bones
The eDNA Consultancy Ltd is registered in England and Wales 15508607. VAT no: 482885735 © Copyright The eDNA Consultancy Ltd. All rights reserved.